
When it comes to safety, are you looking forwards or backwards?
That’s the real difference between leading and lagging indicators. You’re either reacting to problems that have already happened or you’re getting out ahead of them. Lagging indicators are the classic metrics we all track, things like injury rates or lost time. They measure what went wrong after the fact. Leading indicators, on the other hand, are proactive. Think of metrics like how many safety inspections you completed or the percentage of your crew that attended the toolbox talk. They give you a clue about what your future safety performance will look like.
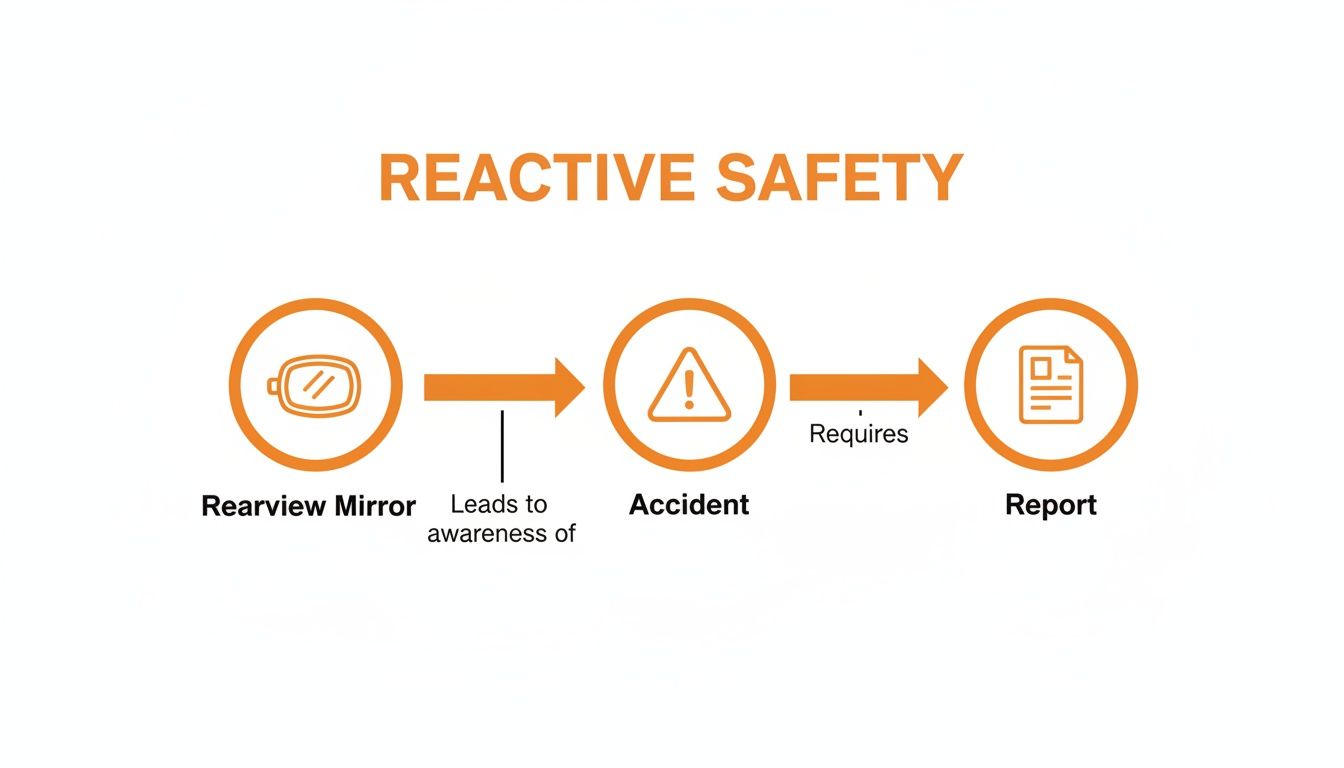
Stop Driving Your Safety Program by Looking in the Rearview Mirror
For too many safety and operations managers in construction and manufacturing, the approach to health and safety is stuck in reactive mode. An incident happens, you investigate it, you file the paperwork, and then you try to bolt on a fix.
Let’s be honest: this model is fundamentally broken.
Relying only on incident reports is like trying to drive a car forward while staring into the rearview mirror. Sure, you get a crystal-clear view of the hazards you’ve already hit, but you have absolutely no idea what’s coming up on the road ahead.
This reactive loop leaves you constantly playing catch-up, only dealing with risks after they’ve already caused harm, project delays, or painful fines. It’s a stressful, inefficient, and frankly, outdated way to manage workplace safety.
There’s a much better way. By using a smart mix of both leading and lagging indicators, you get the full picture. It’s how you finally shift from putting out fires to preventing them in the first place. You start spotting risks early and fixing problems before they ever have a chance to become expensive, harmful incidents.
What This Means for You
Getting on the front foot with your safety indicators isn't just about better paperwork. It's about real, tangible results.
- Anticipate problems: You’ll start to see the warning signs and address hazards before they can cause an accident.
- Prevent costly incidents: A proactive approach keeps your team safe, which also means avoiding the massive financial fallout from injuries, equipment damage, and blown deadlines.
- Keep projects on track: A safer site is a more productive site. Fewer disruptions mean smoother operations and a much better chance of hitting your project timelines.
- Move beyond compliance: Instead of just ticking boxes to keep the regulator happy, you’ll be actively managing safety in a way that actually works and protects your people.
This guide is designed to give you a practical way to use leading and lagging indicators to finally get ahead of your safety issues. We won’t just talk theory. You’ll learn how to choose the right metrics for your specific job site or factory floor and build a safety program that looks forward, not backward.
Understanding the Difference Between Leading and Lagging Indicators
If you want to get a real handle on safety, you need to understand two completely different types of metrics: leading and lagging indicators.
The easiest way to think about it is to imagine you're driving a car. Lagging indicators are like your rearview mirror, they show you exactly what's happened behind you. Leading indicators are your windscreen, giving you a clear view of the road ahead. You need both to get where you’re going safely.
Lagging indicators are your outcome metrics. They measure the results, the good and the bad, after they’ve already happened. They're what regulators and auditors usually ask for first because they provide a concrete, historical record of your safety performance.
On the flip side, leading indicators are proactive and forward-looking. They measure the actions you’re taking right now to stop incidents from happening in the first place. These are the inputs that really drive your safety results, giving you a chance to course-correct before something goes wrong.
Lagging Indicators Tell You About the Past
Lagging indicators are reactive by their very nature. The good thing about them is they’re usually simple to measure because they track concrete events that have already happened. While they can't predict the future, they are absolutely critical for understanding the consequences of past actions.
You're probably already tracking many of these, like:
- Lost Time Injury Frequency Rate (LTIFR): How many injuries were serious enough to cause someone to miss work.
- Total Recordable Injury Rate (TRIR): A wider net that captures any work-related injury needing medical treatment beyond basic first aid.
- Cost of Equipment Damage: The dollar value of damage to machinery, vehicles, or property from an incident.
- Number of Workers' Compensation Claims: A straightforward count of official injury claims filed by your team.
This is the classic reactive safety cycle. You're constantly looking in the rearview mirror, reacting to an accident, and then filling out the report.
If you only focus on these outcomes, you’re always playing catch-up. You're managing problems, not preventing them.
In Australia's industrial scene, lagging indicators paint a pretty stark picture of what happens when things go wrong. For Health and Safety Managers, a spike in the LTIFR often shows up months after a hazard has been brewing, like when poor subcontractor oversight leads to a 20-30% jump in incidents.
In high-risk sectors where production pressure is always on, these lagging numbers expose the true cost of inaction, burying HR in administrative nightmares and racking up fines that average $50,000 per serious breach. You can read more about the economic connections to these safety indicators.
Leading Indicators Help You See the Future
Leading indicators, on the other hand, are predictive. They measure the processes, conditions, and positive actions you can directly influence to make your workplace safer. By keeping an eye on these, you can spot worrying trends and step in before they turn into an incident.
Lagging indicators show you where you have been; leading indicators help you see where you are going.
These metrics focus on what your team is actively doing to stay safe. Common examples include:
- Percentage of Safety Inspections Completed: Are your critical checks on equipment and work areas actually getting done on schedule?
- Number of Hazard Reports Submitted: This shows how engaged your crew is in actively spotting and flagging potential risks.
- Safety Meeting Attendance Rates: A simple measure of how involved your team is with key safety communications.
- Corrective Actions Closed on Time: How fast are you at fixing the problems you find? This is a huge one.
Leading vs Lagging Indicators At a Glance
Putting them side-by-side really clarifies the difference. This table breaks down their core characteristics so you can see how they fit together.
| Characteristic | Leading Indicators | Lagging Indicators |
|---|---|---|
| Timing | Proactive (before an event) | Reactive (after an event) |
| Focus | Prevention and processes | Outcomes and results |
| Purpose | To predict future performance | To measure past performance |
| Example | Number of toolbox talks held | Number of injuries reported |
Ultimately, you need a healthy balance of both to get the full picture. Your lagging metrics confirm whether your long-term strategy is working, while your leading metrics give you the day-to-day control you need to make it happen.
Practical Indicator Examples for Your Industry
Theory is one thing, but making it stick is another. What works in a quiet office is worlds away from what’s needed on a busy construction site or a humming factory floor. The real trick is to pick metrics that speak directly to your biggest risks and the daily realities of your operation.
Let's get into some concrete examples of leading and lagging indicators you can actually use, tailored for the construction and manufacturing sectors. Think of these as a solid starting point you can build on.
For the Construction Site
Construction sites are organised chaos. You’ve got multiple subbies, heavy machinery everywhere, and conditions that change by the hour. Your indicators have to keep up.
A great leading indicator is the frequency of site safety inspections. It’s a simple question: are your supervisors walking the site daily or weekly, actively looking for hazards? Tracking this gives you a direct measure of how proactive your team is being.
Another powerful one is tracking subcontractor safety meeting attendance. If you see attendance dipping, it can be an early warning sign of disengagement or a breakdown in communication, long before an incident happens with that crew.
And of course, the number of near misses reported is a classic for a reason. A high reporting rate isn't a red flag that your site is dangerous; it’s a sign that your team feels safe enough to speak up about potential problems. To get this right, you need a solid process. You can find some great tips on how to improve your near-miss reporting process to encourage your team to share what they’re seeing.
On the flip side, construction lagging indicators are the cold, hard facts after something has gone wrong.
- Lost Time Injuries (LTIs) per project: This tells you exactly how many incidents were bad enough to keep a worker from their next shift.
- Total cost of equipment damage incidents: Putting a dollar figure on accidents is a surefire way to get management’s attention.
- Number of regulator-issued notices or fines: This is a crystal-clear sign that your compliance has fallen short.
For the Manufacturing Plant
In a factory setting, the risks often revolve around machinery, repetitive tasks, and handling materials. So, your indicators should zero in on controlling those specific hazards.
An excellent leading indicator for the factory floor is the completion rate of machine guarding checks. This simple metric shows if your most critical safety hardware is actually being inspected like it should be. You could also track the frequency of lockout/tagout audits to make sure those crucial energy control procedures are being followed to the letter.
Another valuable leading metric is tracking chemical handling training completion. This confirms your people have the know-how they need before they start working with hazardous substances, not after.
By focusing on leading indicators like inspection compliance and training rates, you are actively managing the conditions that prevent incidents, rather than just counting the incidents themselves.
Manufacturing lagging indicators give you that clear historical picture of your safety outcomes.
- Total Recordable Injury Rate (TRIR): This is a standard measure that captures any work-related injury needing more than basic first aid, giving you a broad overview of your performance.
- Number of ergonomic-related injury claims: This helps you spot trends tied to manual handling and how your workstations are designed.
- Days Away From Work (DAFW): This counts the total days employees couldn't work due to an injury, highlighting the true severity of past incidents.
By tracking a balanced mix of these industry-specific indicators, you stop just documenting failures. You start building a system that gives you real-time insight, letting you make smarter, data-driven decisions that actually protect your people and your projects.
How to Choose and Measure the Right Indicators
Knowing what leading and lagging indicators are is one thing; picking the right ones for your site is a completely different beast. It’s easy to fall into a couple of common traps: either tracking way too many metrics and drowning in data, or just picking the easy-to-measure stuff that doesn't really move the needle.
The real goal is to choose a focused set of indicators that are laser-focused on your biggest risks.
Start by asking a simple question: "What's most likely to cause a serious incident on this project?" If falls from height are a major headache at your construction site, then an obvious leading indicator is scaffolding inspection compliance. If machine entanglement is the primary risk in your factory, a key leading indicator becomes the percentage of lockout/tagout audits completed.
This approach makes sure your metrics aren't just numbers on a spreadsheet. They become genuine tools that directly tackle your most critical safety issues.
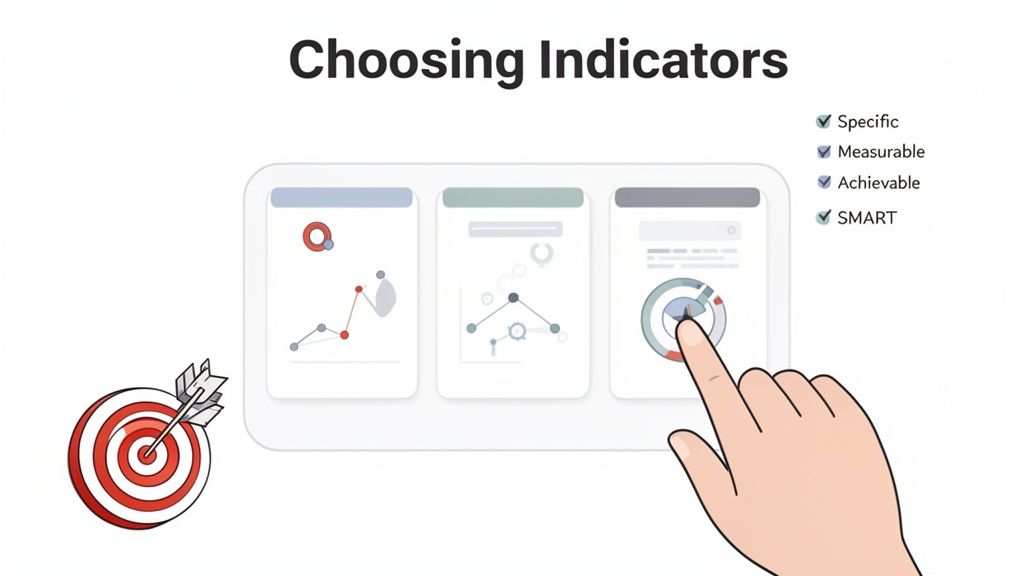
Use the SMART Method
Once you've zeroed in on your key risk areas, the next step is to make sure your chosen indicators are actually effective. A brilliant way to do this is by applying the SMART criteria. This simple framework helps you turn vague ideas into concrete, trackable metrics that get results.
Each of your leading and lagging indicators should be:
- Specific: It needs to be crystal clear what you're measuring. "Improve safety" is fuzzy; "95% completion rate for weekly mobile plant pre-start checks" is specific.
- Measurable: You have to be able to track it with a number. If you can’t put a number to it, you can’t manage it effectively. Simple as that.
- Achievable: Set realistic targets. Aiming for 100% completion on all safety forms from day one might just discourage your team. Start with a reachable goal, like 80%, and build momentum from there.
- Relevant: Does this metric actually matter to your biggest safety risks? Tracking toolbox talk attendance is only relevant if the topics discussed address genuine site hazards.
- Time-bound: Your goal must have a deadline. For example, "Achieve a 10% reduction in minor hand injuries by the end of next quarter."
Using this framework stops you from chasing vanity metrics and focuses your energy on indicators that will genuinely improve workplace safety.
Start Small and Find a Balance
One of the biggest pitfalls is trying to track dozens of indicators at once. This leads straight to analysis paralysis, where you’re so busy collecting data that you don’t have time to act on it. You don't need a massive, complicated dashboard to get started.
The key is to start with a small, balanced mix of leading and lagging indicators. Aim for three to five leading indicators and one or two core lagging indicators.
This focused approach lets you see the direct connection between the proactive steps you’re taking (leading) and the results you’re getting (lagging).
For example, the connection between economic pressures and safety incidents is well-documented. In Western Australia construction, Safe Work Australia stats show lagging serious claims rose 12 percent year-on-year in 2023-24. This often followed unheeded leading cues, like a 25 percent hike in hazard reports during periods of economic strain. This highlights how a leading indicator (hazard reports) can predict a lagging one (serious claims), a principle you can apply directly to your own site.
If you're looking to get a better handle on your lagging results, you might be interested in our guide on how to calculate your own accident frequency rate.
By starting with a manageable set of indicators, you can build a system that provides actionable insights without overwhelming your team. As you get more comfortable, you can always adjust and add new metrics that align with your evolving operational risks.
Using Safety Space to Turn Your Data Into Action
Knowing the difference between leading and lagging indicators is a great start. But trying to collect, track, and make sense of them with messy spreadsheets is a fast track to frustration. This is where theory hits a wall in the real world.
To genuinely get ahead of workplace incidents, you need a system that translates your data into clear, actionable steps, without burying you in paperwork.
This is exactly what Safety Space was built for. It gets you away from clunky, manual processes and into a system that makes tracking both leading and lagging indicators simple and effective. Instead of digging through files to find last month's inspection records, you get real-time visibility into what’s happening on your sites, right now.
See Your Trends in Real Time
One of the biggest headaches with manual tracking is actually spotting a trend. A steady dip in safety observations across three different sites might go completely unnoticed for weeks, but it’s a critical leading indicator that something is going wrong.
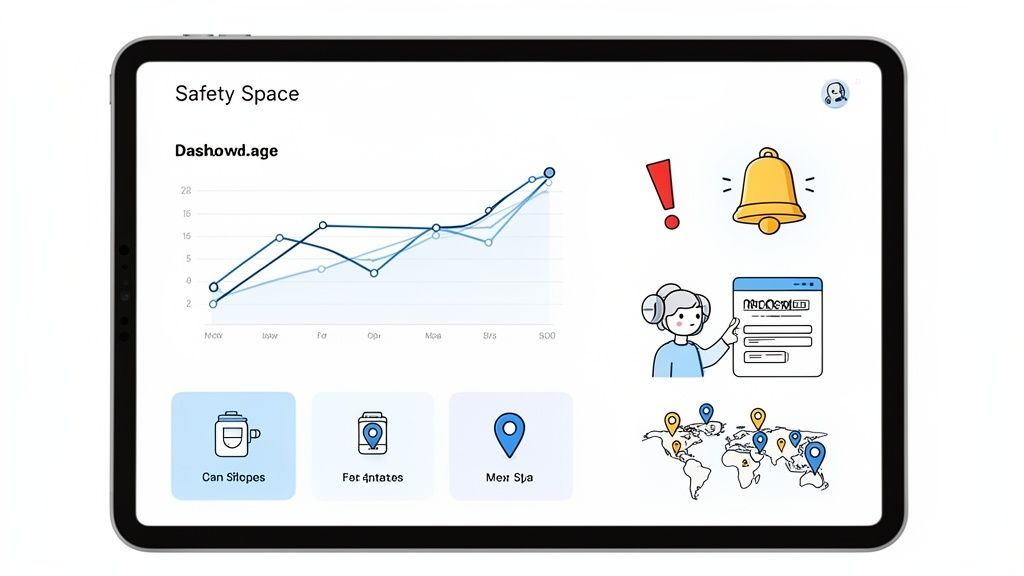
Safety Space solves this with customisable dashboards. At a glance, you can see all your key metrics, letting you instantly compare performance across multiple projects or factory floors.
This real-time monitoring means you can:
- Pinpoint problem areas quickly: See which sites are falling behind on inspections or hazard reporting.
- Track corrective action close-out rates: Know instantly if critical fixes are being completed on time.
- Monitor subcontractor performance: Keep a close eye on the leading indicators for all your contractors from one central hub.
With a clear, visual dashboard, you stop reacting to old data and start making decisions based on what’s happening right now. It connects your proactive efforts directly to your safety outcomes.
Capture Better Data Without the Hassle
Getting good data for your leading indicators completely relies on your team in the field. Let's be honest, if filling out a hazard report is a complicated, time-consuming process, your crew simply won't do it. This creates a dangerous blind spot in your safety program.
Our platform is designed to help you capture more accurate data, faster. Features like AI-assisted form completion make it incredibly easy for anyone on site to report a near-miss or submit an inspection. The system can pre-fill information and guide users through the process, which means you get more consistent and higher-quality data to fuel your leading indicators.
This has a direct impact on your ability to predict and prevent incidents. You can learn more about how this works in our complete guide to predictive safety analytics.
Get Notified Before It’s Too Late
The real power of tracking leading indicators is the ability to act on negative trends before they turn into incidents. But you can’t act on what you can’t see.
Safety Space includes automated alerts that notify you the moment a key metric goes in the wrong direction. Imagine getting an immediate alert when safety observations on a high-risk project drop by 50% in a week. That’s a powerful leading indicator that lets you intervene immediately, find out what’s going on, and fix the issue before it leads to an injury.
In the high-stakes world of Australian construction and manufacturing, this proactive edge is absolutely critical. It helps firms avoid the hefty fines, which can be up to $1.5 million under Work Health and Safety laws, that lagging incidents trigger.
By linking your data directly to action through real-time dashboards, easy data capture, and smart alerts, Safety Space gives you the tools to build a truly proactive safety system. It simplifies your compliance paperwork and builds accountability by making performance visible to everyone involved.
Common Mistakes to Avoid When Setting Up Your System
Getting a system in place to track leading and lagging indicators is a massive step in the right direction. But it's surprisingly easy to get tripped up by a few common mistakes right out of the gate.
Knowing what these pitfalls are ahead of time can save you a world of headaches and make your safety program genuinely effective, not just a box-ticking exercise. The goal is to build a system that gives you real, useful information, not one that just generates more paperwork.
Here are the most frequent stumbles we see and how to steer clear of them on your site.
Focusing Only on One Type of Indicator
This is a classic. A company gets excited about being proactive and goes all-in on leading indicators, completely ignoring their lagging metrics. Or they do the opposite, staying fixated on incident rates without tracking the activities meant to prevent them.
You need both sides of the coin to get the full picture. It’s like trying to navigate with only half a map.
Think of it this way: leading indicators are the effort you're putting in daily, while lagging indicators are the results you get at the end of the month. If you only track the effort without ever checking the scoreboard, you're just hoping your actions are making a difference.
A balanced set of leading and lagging indicators is non-negotiable. One tells you what you're doing; the other tells you if it's actually working. Without both, you're flying blind.
Setting Unrealistic Targets
When you first roll out a leading indicator like hazard reporting, it’s tempting to aim high. Let's say you mandate that every worker must submit five hazard reports a month. It sounds productive, right?
But in the real world, this almost always leads to "pencil-whipping," where people just fill out forms with trivial issues simply to hit a number.
Example Scenario: A construction supervisor, feeling the pressure to meet a lofty reporting target, tells his crew to report things like "a small puddle of water" or "a messy toolbox" just to get their numbers up. Suddenly, the system is flooded with low-value noise, and the serious hazards, the ones that could actually hurt someone, get lost in the static.
Focus on quality over quantity. It's far better to get one genuine, high-risk hazard report than ten meaningless ones. Set achievable targets and make it crystal clear that the real goal is to find and fix genuine risks, not just to tick a box.
Forgetting to Explain the 'Why'
If you just drop a new set of metrics on your team without explaining why you're tracking them, they'll see it as more pointless admin. And frankly, you can't blame them.
Your crew on the factory floor or the construction site needs to understand how reporting a near-miss helps protect them and their mates.
When they get that reporting a close call isn't about getting someone in trouble, but about preventing a future injury, they’re far more likely to buy in. You have to connect the dots for them. Take the time to explain how these small, daily actions contribute to the big-picture goal of everyone going home safe.
Failing to Review and Adjust
Your safety indicators are not set-and-forget. The risks on a project change constantly. What was a critical metric during the excavation phase might be far less relevant during the internal fit-out.
A common failure is setting up indicators once and then never looking at them critically again. They just become part of the background noise.
Schedule regular reviews, quarterly is a good starting point, to ask a simple question: "Are these indicators still telling us what we need to know?" If one of your leading indicators is consistently high but your lagging injury rate isn't budging, that's a red flag. It’s probably time to re-evaluate and pick a new metric that’s more directly tied to your current risks.
Got Questions About Safety Indicators?
Once you start digging into leading and lagging indicators, a few practical questions always pop up. Here are the straight answers to the ones we hear most from safety managers out on the ground.
How Many Leading Indicators Should We Start With?
It’s tempting to want to track everything at once, but that's a classic mistake. We’ve seen businesses build massive dashboards that are so cluttered they become completely useless.
If you’re in construction or manufacturing, the best way forward is to start small and focused. Pick just three to five key leading indicators that directly relate to your biggest risks on site. This approach keeps everyone focused and makes it dead simple to see how your proactive work is actually influencing your safety outcomes.
How Do We Get Our Team to Report More Near Misses?
This is a tough one for a lot of companies. Getting people to put their hand up and report a near miss often runs into a wall of fear; workers are worried they’ll be blamed or get someone in trouble.
The solution is to build a dead-simple, no-blame reporting process. You have to make it crystal clear that the whole point is to learn from these close calls so you can stop a real accident from happening. It’s not about pointing fingers. Frame near-miss reporting as one of the most powerful, positive things a worker can do for everyone's safety. Swapping out clunky paperwork for a quick mobile form also makes a world of difference.
A steady stream of near-miss reports is one of the best signs of a well-functioning safety system. It means your team trusts the system and is actively looking out for hazards.
Can Good Leading Indicators Guarantee Zero Accidents?
It's a great question, and the answer is crucial. Think of leading indicators as a way to stack the odds heavily in your favour, not as a magic bullet that eliminates all risk.
When your leading indicators look great, say, you're hitting 100% completion on pre-start checks or your hazard reporting rates are high, you are drastically reducing the chances of an incident. It proves you're on top of your risks. But can it guarantee an accident will never happen? No. Unexpected things can and do happen. What a solid system of leading and lagging indicators does is give you the absolute best chance to see trouble coming and prevent it.
Ready to stop wrestling with spreadsheets and start turning your safety data into meaningful action? Safety Space provides the tools to track your indicators in real-time, spot dangerous trends before they lead to an incident, and make your entire safety process simpler. Book a free demo and have a chat with our team today.
Ready to Transform Your Safety Management?
Discover how Safety Space can help you implement the strategies discussed in this article.
Explore Safety Space FeaturesRelated Topics
Safety Space Features
Explore all the AI-powered features that make Safety Space the complete workplace safety solution.
Articles & Resources
Explore our complete collection of workplace safety articles, tools, and resources.