TRIFR equals recordable injuries divided by total hours worked, multiplied by 1,000,000, which reports the result as injuries per one million hours worked. The formula is short, and everything that makes the number useful or misleading happens outside it.
The advice you'll hear most often is to pick a benchmark, put TRIFR at the top of the monthly board report and push it down year on year. That advice breaks on any site where more than one company works. A principal contractor with 40 direct employees and 200 subcontractor workers can move its rate substantially by deciding that only its own people's hours belong in the denominator, and not one injury has to change for that to happen.
A rate is a measurement decision before it's a safety result. Two things set the figure before any safety conclusion gets drawn: whose hours sit underneath the line, and whose injuries are counted above it. Write those rules down and TRIFR becomes a usable trend line. Leave them fuzzy and it becomes a number that flatters whoever reports it.
Table of Contents
- The TRIFR Formula at a Glance
- How to Calculate TRIFR Step by Step
- Australian Benchmarks for Accredited Companies
- Whose Hours and Injuries Count on a Shared Site
- What TRIFR Misses and Which Measures to Report With It
- Check Your TRIFR Before You Report It
The TRIFR Formula at a Glance
A low TRIFR is the easiest number in safety reporting to produce and the hardest to interrogate. The arithmetic itself is fixed: recordable injuries divided by total hours worked, multiplied by 1,000,000. In Australia, the Office of the Federal Safety Commissioner applies this measure to companies accredited under the national Work Health and Safety Accreditation Scheme, as set out in the Department of Employment and Workplace Relations annual report 2025–26. Accredited companies report aggregate safety incidents and hours worked twice each year, and the collective rate is recorded incidents divided by total hours worked, multiplied by 1,000,000.
That fixed denominator does the heavy lifting. A 30-person builder and a 3,000-person contractor both land on a figure expressed per one million hours, so workforce size stops being an excuse for an unreadable number. It's also why an hours change moves the rate as hard as an injury does. A bigger denominator lowers the figure without a single injury being prevented.
Only four inputs produce the figure, and each one has a boundary worth writing down.
| Input | What belongs in it | What shouldn't |
|---|---|---|
| Recordable injuries | Fatalities, lost time injuries, restricted work injuries and medical treatment injuries recorded in the period | First aid cases, near misses, hazards closed out |
| Total hours worked | Hours actually worked in the same period, by the same population the injuries come from | Paid leave, rostered days off, and hours from a group whose injuries you excluded |
| The 1,000,000 multiplier | A fixed constant, so every result uses the same base | A shorter hours base used in some overseas reporting, unless the report says so |
| The result | Injuries per one million hours worked | Severity, exposure, or how many controls failed |
Most arguments about TRIFR are really arguments about those four cells. The Department of Employment and Workplace Relations annual report 2025–26 reports the collective rate for accredited companies falling from 7.35 injuries per one million work hours in 2020 to 6.49 in 2024, a reduction of about 11.7 per cent. What the series can't tell you is how much of that fall came from fewer injuries and how much came from more hours sitting under the line.
The habit that makes the number usable: keep the inclusion rules on the same page as the result, so next year's calculation is a repeat rather than a reconstruction.
One limit is built into the definition. TRIFR counts recordable incidents, and that is all it counts. It says nothing about how severe those injuries were, how many near misses came first, how many hazards were fixed, or how exposure differs between a yard crew and a crew tying steel at height. For a construction or industrial business it earns its place alongside injury severity, corrective-action completion and leading indicators such as inspections and worker engagement. On its own it's a numerator, a denominator and a constant.
How to Calculate TRIFR Step by Step
Take a hypothetical site with 150 workers averaging 2,080 hours each across 12 months, and four recordable injuries in the same period. The five steps below are the order to do them in, and the common slip sits beside each one.
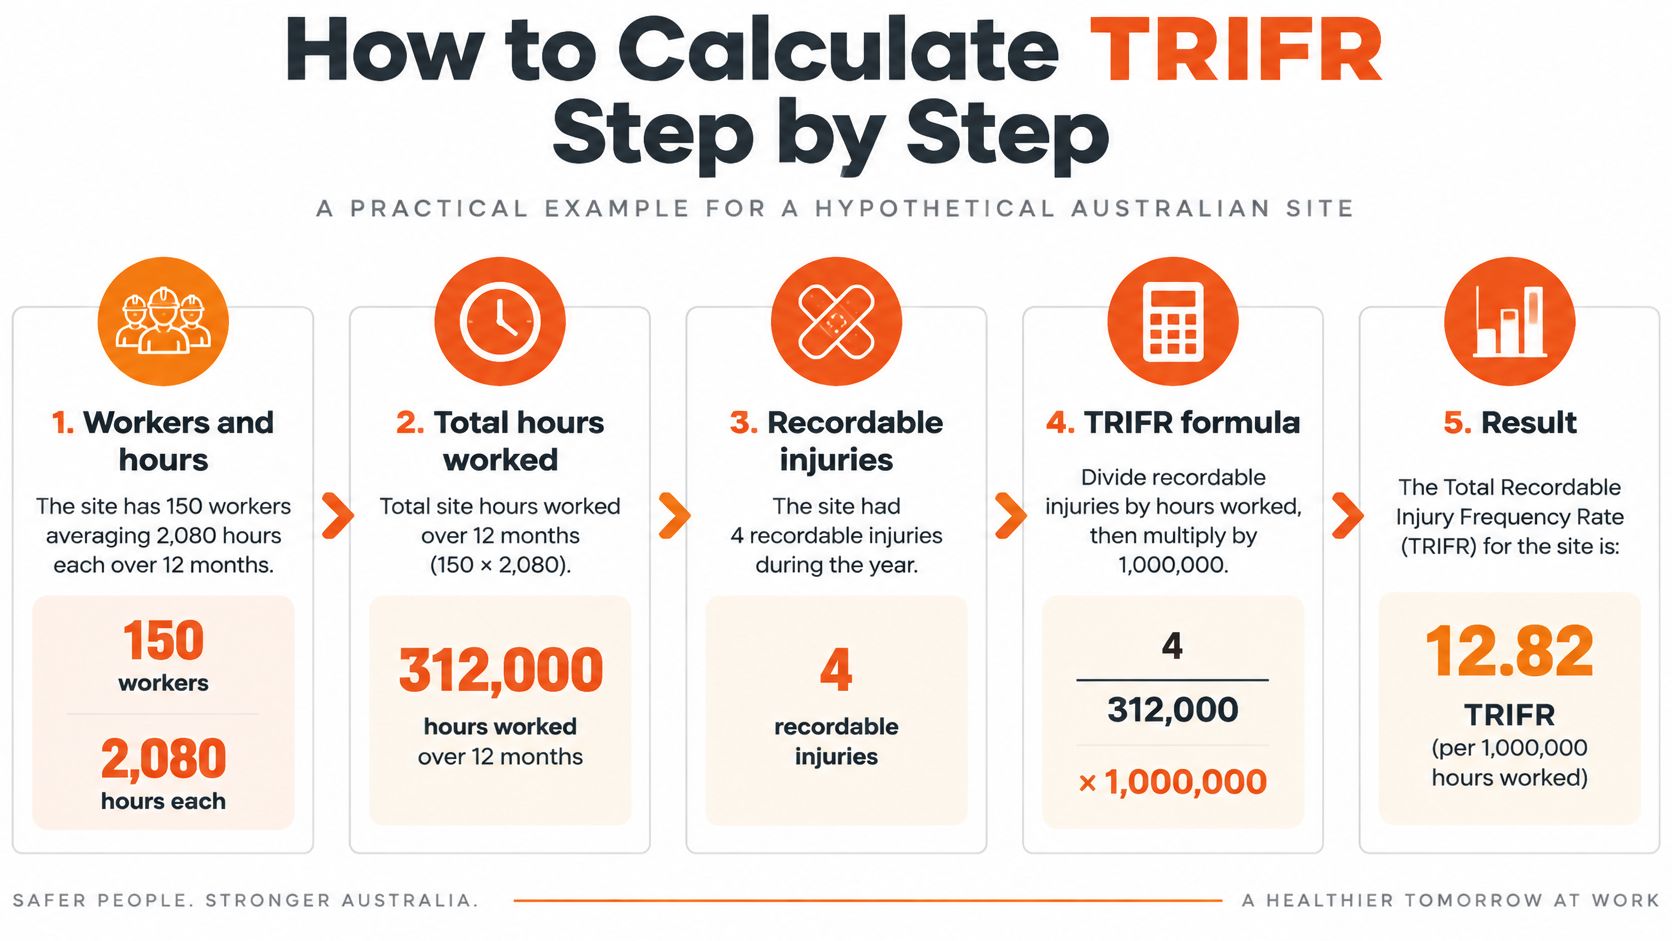
- Fix the period before anything else. Injuries and hours must cover the same 12 months and the same population. The classic error is calendar-year injuries divided by financial-year hours, which produces a rate that describes no real year at all.
- Build hours from records, not headcount. 150 workers at 2,080 hours gives 312,000 hours worked. Multiplying headcount by a 38-hour week and 52 weeks guesses at hours nobody verified. Leaving subcontractor or labour hire hours out shrinks the denominator and inflates the rate, and it's the slip that survives longest because the number looks fine.
- Classify each injury once, to the most serious class that applies. The four recordable injuries here exclude first aid cases, which never enter a TRIFR. The error to avoid is treating an injury as medical treatment in March and lost time in April without restating the period it happened in.
- Divide, then multiply. 4 divided by 312,000 is 0.0000128. Multiply by 1,000,000 and the result is 12.82 injuries per one million hours.
- Record the result with its rules. Period, population, hours source and classification notes belong in the same record as the figure. Without them, next year's number can't be compared with this one in any honest way.
The sensitivity is worth seeing before the figure goes anywhere. One more recordable injury on the same 312,000 hours takes the rate from 12.82 to 16.03, a jump of about 3.2 from a single event. A crew working 40,000 hours moves 25 points on that same injury. That's the arithmetic of small numbers, not a collapse in safety, and it's why a three-year window does more honest work than an annual figure for any crew under a few hundred people.
What the 12.82 tells you is how often recordable injuries occurred per million hours at that site, on the rules you applied. What it doesn't tell you is whether the four injuries were sprains or a fractured spine, how many near misses went unlogged, or whether the crew's exposure shifted in month seven. Those are separate questions with separate measures. If the arithmetic keeps getting relitigated in meetings, put the numbers through an accident frequency rate calculator and spend the time on classification rules instead.
Australian Benchmarks for Accredited Companies
| Year | Population | Collective TRIFR |
|---|---|---|
| 2022 | All accredited companies | 5.85 |
| 2023 | All accredited companies | 6.41 |
| 2023 | Construction-related (civil, commercial and residential) | 6.72 |
Two of those rows work as a general reference. The third can't be borrowed by everyone.
Between 2022 and 2023 the collective rate for all accredited companies rose from 5.85 to 6.41 injuries per one million hours worked, an increase of about 9.6 per cent in a single year, while the construction-related population covering reported residential, civil and commercial activity posted 6.72, some 0.31 injuries per million hours or roughly 4.8 per cent above the all-company result, as the Department of Employment and Workplace Relations annual report 2024–25 records. An accreditation framework with audits and twice-yearly reporting still posted a worse year. The rise reflects small-number arithmetic and a shift in the mix of work, which is why a single year's movement should never reach a board as a trend.
Which row to compare yourself with
An accredited commercial builder has a defensible reference point in the 6.72 figure for 2023. A manufacturer doesn't, and neither does a cleaning contractor, because their exposure and their reporting population sit outside that construction population entirely. Comparing a 2024 all-company result against a 2023 construction figure mixes two populations and two years at once, and the answer means nothing either way.
Sitting below the benchmark doesn't certify much on its own either. A company that counted a narrow set of hours can post a low rate and still be running the worse site, which is why the population question has to be settled before the comparison means anything.
There's a period trap as well. Published benchmarks are counted over their own reporting window, and it won't always match yours. If your figures run July to June, convert or state the basis in the same record as the result. A July-to-June rate set against a January-to-December benchmark compares two different windows and can't show movement in either direction.
Treat the benchmark as a reference point for a conversation. The population behind it isn't yours, so it can't grade your performance.
Comparability turns on details the published figure can't show: how a recordable injury was defined, the mix of trades and support staff in the counted workforce, whether subcontractor hours sat in the denominator, and how those hours were calculated. Document your inclusion rules and hold your reporting periods steady year to year. A rate that changes because the measurement changed is worse than no rate at all, because somebody will act on it.
Whose Hours and Injuries Count on a Shared Site
On a shared site, the principal contractor, the subcontractors, the labour hire provider and the site operator can each be a PCBU. Under Australia's model WHS laws every PCBU holds the primary duty to ensure health and safety so far as is reasonably practicable, and in construction each must consult with workers and consult, cooperate and coordinate with other duty holders, as Safe Work Australia's construction WHS duties guidance sets out. Five duty holders can each hold part of the same risk and each report a different rate for the same month.
That's the scoping problem, and it gets settled before any safety conclusion. Four decisions do most of the work.
- Which companies' injuries count. Only the reporting entity's own workers, or every worker on the site? Pick one and write it where a client can read it.
- Whose hours go underneath. Direct employees only, or employees plus subcontractors and labour hire? A denominator that excludes the trades doing most of the physical work produces a rate that looks better and means less.
- How labour hire, visitors and deliveries are classified. A labour hire worker injured under your supervision is a recordable injury for somebody. Decide who, and record it once, or both companies log it.
- Who reports the combined figure. One named person owns the site total. Everyone else sends counts and hours on a set date.
Settle those in the subcontract and again at induction. Three questions cover most of it: whose hours are in the denominator, who logs an injury to a labour hire worker, and which company's figure goes to the client? Working out contractor versus subcontractor status first makes the rest simpler, because the label drives who holds the duty and who holds the hours.
Double counting is the visible failure. One incident turns up in two companies' counts and the site total inflates. Leaving out a subcontractor's hours is the invisible one, and it's worse because the rate improves while the hazard stays put. Neither is a safety event. Both change the number.
New Zealand has the same scoping problem, since the Health and Safety at Work Act 2015 uses the same PCBU concept and WorkSafe NZ as the regulator. Groups reporting across both countries should run one rule set, not two.
If contractors arrive through a client's induction process rather than your own, a plain summary of contractor safety requirements from Blue Gas Express is a useful cross-check on what the host expects to see before a crew starts.
What TRIFR Misses and Which Measures to Report With It
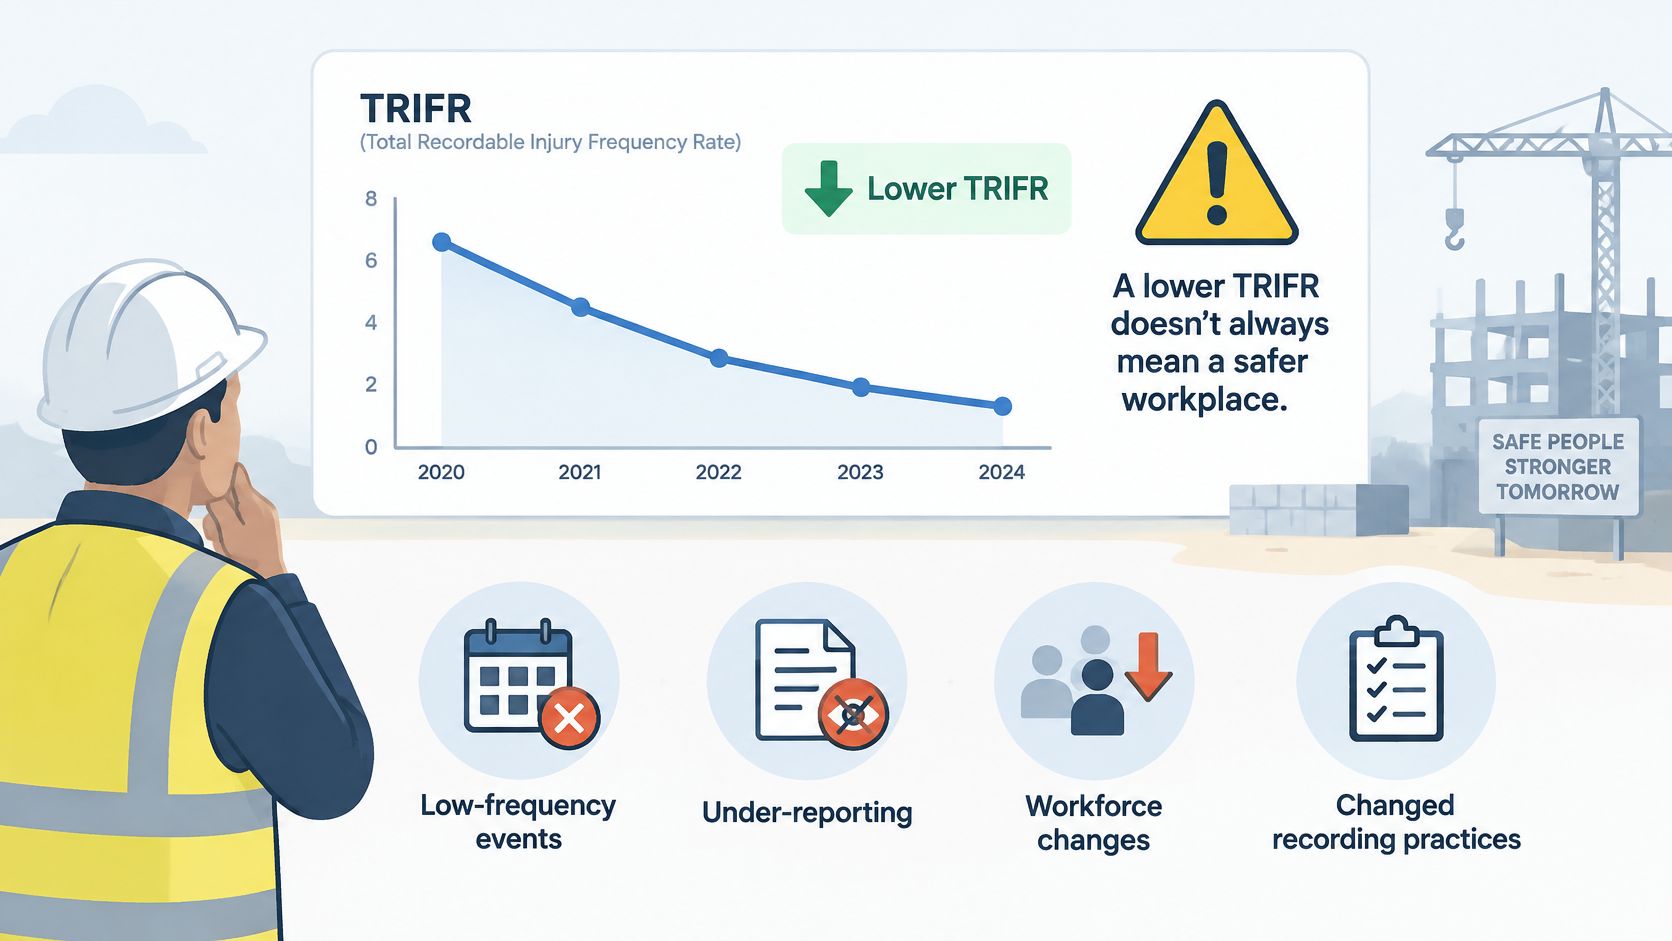
A falling rate can reflect reporting changes as much as genuine risk reduction, and most TRIFR reporting errors live in that gap.
The falling rate that hides a rising risk
A TRIFR improves for reasons that have nothing to do with a safer site. A quiet year on low-frequency events. Injuries that were never reported. A restructure that moved the high-exposure work into another entity, lifting it out of the hours and the count at the same time. A treatment reclassified as first aid. Every one of those reads as a better number with the hazard unchanged.
Safe Work Australia's key work health and safety statistics record 146,700 serious workers' compensation claims involving at least one week of lost time in 2023–24, with 84 per cent of them falling under five broad harm mechanisms: body stressing, falls, slips and trips, being hit by moving objects and mental stress. A frequency count compresses all of that. TRIFR counts the injuries that meet its definition and gives no weight to which mechanism produced them or how much damage each one did.
The harms a low count doesn't show
Fatality data makes the point harder to dismiss. 200 workers were fatally injured at work in Australia in 2023, against 195 in 2022, and the six industries with the largest concentration of traumatic injury fatalities and serious claims accounted for 76 per cent of fatalities and 61 per cent of serious claims, according to Safe Work Australia's 2024 statistics release. Construction and manufacturing sit inside that group, which is precisely the population most likely to be managing to a TRIFR target.
Safe Work Australia's key WHS statistics data attributes 42 per cent of worker fatalities in 2023 to vehicle incidents, or 84 deaths, and 15 per cent to falls from height, or 29 deaths, a mechanism that rose 71 per cent on the previous year. On a construction, waste or manufacturing site those two mechanisms map onto traffic management and mobile plant on one side, and work at height on the other. A year with no lost time injuries can sit directly on top of both.
Work involving a risk of falling more than 2 metres is one of the triggers that makes a safe work method statement mandatory, alongside trenches deeper than 1.5 metres, work near energised electrical services and powered mobile plant, as Safe Work Australia's guidance on high-risk construction work explains. Exposure to those triggers is what's worth counting when the injury count is quiet.
A low TRIFR in a year of heavy mobile plant and roof work invites scrutiny. The controls are the evidence. The rate is the lagging shadow they cast.
Report TRIFR beside the measures that see the rest
Pick a small set and keep it stable. These six cover what a frequency rate structurally cannot.
| Measure | What it shows | Why it sits beside TRIFR |
|---|---|---|
| LTIFR | Lost time injuries per one million hours worked | Shows how many injuries caused time off work, which TRIFR doesn't separate out |
| Injury severity | Days lost or seriousness of the injuries recorded | Shows whether a low count is hiding serious harm |
| High-potential near misses | Events that could have caused serious harm | Gives early warning before an injury happens |
| Corrective action closure time | Days from finding to completed fix | Shows whether hazards are removed rather than just recorded |
| Inspection completion rate | Planned inspections completed on schedule | Shows whether controls are being checked |
| Worker-reported hazards | Hazards raised by workers in a reporting period | Shows whether the reporting culture can support the rate |
Start where the harm concentrates. For construction, waste and manufacturing, that usually means traffic management and mobile plant controls first, then work at height, then the manual handling and mental stress exposures behind the bulk of serious claims. Two companion measures per critical risk is enough to show movement. A scorecard of twenty gets read by nobody.
Where those records live in software, Safety Space keeps incident and injury reports, hazard registers, inspections and corrective actions against each site or project, and its dashboards and reports give the companion figures a consistent home instead of a spreadsheet rebuilt every month. Choosing the companions deliberately matters more than the tool; a short set of incident management metrics reported monthly beats a long one reported once a quarter.
In every leadership report, label the rate as one lagging signal and place it next to at least two companions. A report that leads with the rate alone turns the metric into a scoreboard, and a scoreboard rewards the one behaviour that corrupts the whole dataset: the injury nobody reports.
Check Your TRIFR Before You Report It
Run this check before the figure leaves the building.
- Match the populations. Injury count and hours must cover the same period and the same people, including subcontractor and labour hire hours where the framework requires them. A mismatch is the most common cause of a wrong rate.
- Hunt for a double count. One injury logged by two companies on the same site inflates both the site total and the group figure.
- Confirm the rules are written down. Period, inclusion rules and result in one record, so next year repeats the calculation instead of reinventing it.
- Compare only like with like. Same population, same period, same hours base. A 2024 all-company figure against a 2023 construction benchmark compares two different things.
- Add at least two companions. Severity, near misses or corrective action closure, chosen before the meeting rather than after the question.
- State the limit in one sentence. Write down what the rate doesn't show, so nobody downstream reads it as a verdict.
The same discipline holds wherever incidents arrive from a dispersed workforce. A transport operator logging driver incidents faces the identical question of whose hours and whose injury belong in the count, and incident reporting for coach operators is a useful reference for how that record is structured when vehicles, depots and contractors all generate events. A rate built on agreed rules and steady periods will survive a bad year. One built on convenience won't survive a good question.
Safety Space gives WHS and operations teams one place to hold the records a TRIFR depends on: incident and injury reports, hazard registers, inspections and corrective actions, filed by site or project and reported through dashboards. If the arithmetic in this article is the easy part and the counting rules are where the arguments start, that's the gap it closes. Visit Safety Space to see how the modules fit your sites, your contractors and your reporting period.
Ready to Transform Your Safety Management?
Discover how Safety Space can help you implement the strategies discussed in this article.
Explore Safety Space FeaturesRelated Topics
Safety Space Features
Explore all the AI-powered features that make Safety Space the complete workplace safety solution.
Articles & Resources
Explore our complete collection of workplace safety articles, tools, and resources.